A reader currently send me the following email:
“I am currently working on a 12 month budget which my manager requires in pivot form – however the report involves various different branches with different addresses etc and its proving difficult to produce a spreadsheet detailing this… help 🙂 “
To be honest, I had never created a project budget using pivot tables before. My standard project budget form works very well and people keep telling me how much time they have saved by using this template.
But I was curious and wanted to see how I could add make a “pivotable” project budget.
It’s actually pretty easy.
Let me show you how to do it.
Step 1: Create a data sheet
First create an Excel sheet containing the entire budget data. In order to be able to create a pivot table from it, you need to enter the budget information in table form. See my example:
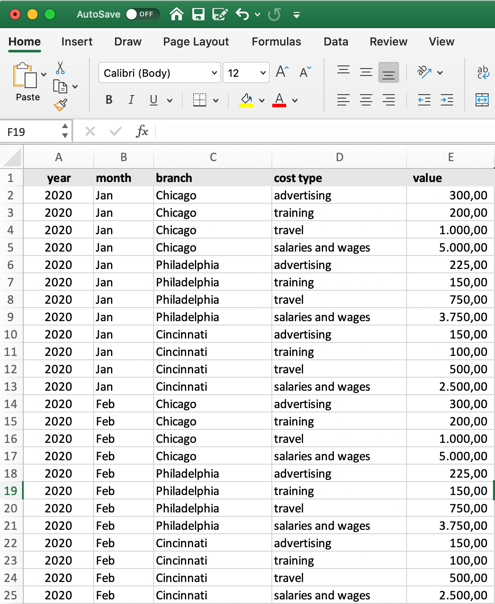
You can see that I’ve broken down the budget into different levels:
- year
- month
- branch
- cost type
These are just examples. You can add as many levels and details as you like. What matters is that you enter all data in a database like format as shown in my example.
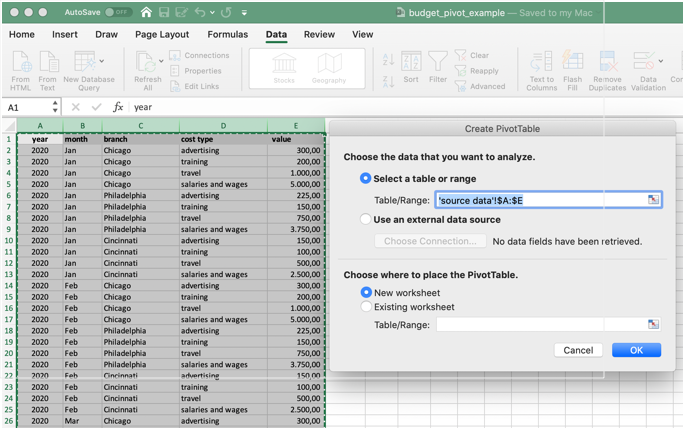
Step 2: Create the pivot table
Select the columns of your data sheet and create the pivot table (Menu > Data > Summarize with PivotTable).
Step 3: Let’s do some pivot analysis
Now here comes the nice part. You can look at your project budget from different angles using the pivot feature.
For example:
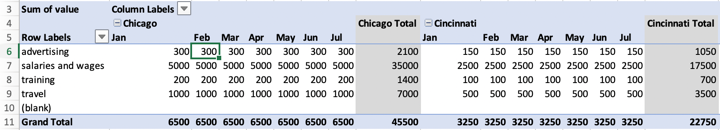
breakdown by cost type, month and branch on the X axis:
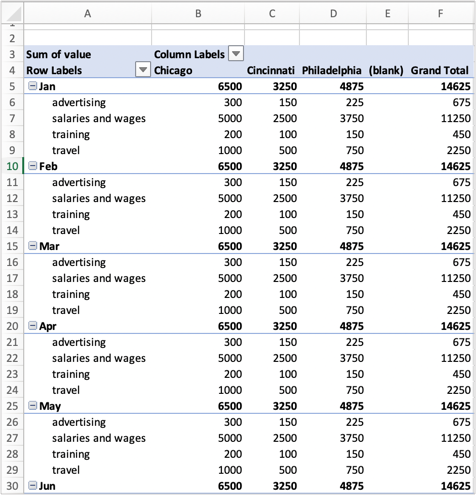
Suppose you want months to be on the horizontal, then just swap rows with columns:
You see — it’s very easy.
All you have to do is enter your budget details in the right format. And voilà – your budget project is available in pivot form.
Download the example
Download project budget in pivot form
Post in the comments if this was helpful.