Managing projects in big organizations can be a challenging. You have to deal with a huge number of people, all with different roles and responsibilities.
The challenge for you is to understand how to involve these folks. Do you just keep them informed? Or should they be involved in the decision making process?
The RACI chart helps to clarify roles on a project task level.
What is a RACI chart?
A RACI chart is a matrix which maps out what role someone has in a specific task or deliverable. It also helps to ensure no stakeholder is forgotten in the process. By creating a RACI chart you’ll avoid surprises like: “I’m sorry, I didn’t know I had to talk to you’, or ‘I thought John was responsible?’.

RACI: What does it stand for?
RACI is an acronym that stands for Responsible, Accountable, Consulted and Informed. The four letters help to memorize the different roles that we have to fill to ensure the proper completion of a task.
The definition of RACI:
- (R) Responsible: This is the person who is in charge of completing the task. It’s usually somebody in your team. Assign only one responsible for each task so nobody gets confused. If you assign multiple people to the same task, chances are nothing will get done. Why? Everyone will think that the other person is going to do the job.
- (A) Accountable: Once a task has been completed, the accountable person has to check if the job has been done properly. It’s usually the manager of the responsible who delegates the work, but it can also be the the responsible (read the section below on responsible vs. accountable).
- (C) Consulted: These are the stakeholders who have to be consulted first before the work is done. Usually these are experts who have deeper knowledge or experience about the subject matter. The reason why you want your team member to consult with an expert first is obvious: you want to limit the risk of project failure.
- (I) Informed: These are stakeholders who have to be informed about the progress of the task. Maybe they are waiting for input so that they can proceed with their own work. Or maybe they just need to know what’s happening. Keeping everyone in the loop and sending out continuous updates is always a good practice in project management.
Responsible vs Accountable – What is the difference?
 You may be confused over the difference between these two roles. Let me clarify here.
- The responsible is the person doing the work: Writing the code, putting one brick on top of the other, painting the wall etc. The person accountable is the colleague who makes sure the work actually gets done. Why make this distinction?
- Imagine that the person in charge falls ill. The walls would not get painted, which would lead to a serious delay of the project. To make sure this does not happen, there must be someone who takes care of the problem and comes up with a solution no matter what. In this case the accountable person would have to look for an external contractor who could step in and do the painting.
Why RACI Charts Are Super Useful
The RACI method has several benefits. First of all, it demands that clear responsibilities are defined in an organization or project.
By putting down actual names, the organization has to decide who’s going to have what role in a project. Nothing stays vague where people sort of feel responsible.
The second advantage is it provides an easy template which we can fill out. We don’t have to worry about forgetting to inform somebody, consult with a team member or have work results approved by an important stakeholder.
Another advantage of RACI is you can see if the workload is shared evenly among team members. If someone is entered as responsible too many times, that would not be fair. Then you look for another person who can take over responsibility for an activity.
When you should use RACI charts
The RACI process is useful in particular situations that meet the following criteria:
- the outcome has a big impact
- the decision making process is unclear
- many people are involved
- overlapping responsibilities
- poor execution or decision making would have terrible consequences
Let’s go through a few a typical situation where the RACI process is useful:
Scenario: Fast decision-making – committee style
With too many cooks in the kitchen, the meal will never be ready. Or reframing this analogy to the corporate world: If too many people are involved in a decision, it will take ages until a decision is made (or no decision will be made at all).
Creating a RACI chart can simplify the decision-making process greatly. What you do is establish something like a committee, where you nominate a small team of people as representatives of a large group of stakeholders. The committee reviews the situation, considers different options, reconciles with all stakeholders and then takes a decision.
A real scenario could look as follows: You are in charge of rolling out new laptops for the sales reps of your company. Now, you can’t just order 100 laptops on Amazon and tell your sales guys: these are for you! You have to involve them in the selection process.
Also, you need to speak to IT to make sure the new hardware meets corporate standards. The third stakeholder to involve is purchasing. They will also have some saying as to what brands to choose from, what distributors to buy from etc. Your sales rep team, IT and purchasing are all stakeholders that have to be consulted before picking a laptop model.
A RACI chart could look as follows:
Task: Choosing new laptop model for sales staff
- R (responsible): John Smith (you)
- A (accountable): Fred Lee (your boss)
- C (consulted): Joanna Mayer (team leader sales), Heather Reding (purchasing consultant), Tom Fraser (head of IT)
- I (informed): Larry Jones (buyer IT – he’s going to enter the purchase order)
Creating a RACI chart
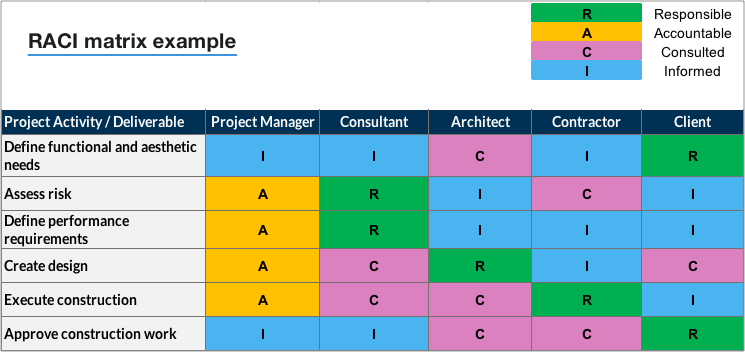
Creating a RACI chart is easy. All you need is either Excel or Powerpoint. To create the chart, draw up a table consisting of multiple rows — one for each activity. Then roles into the column headers, just as I’ve done in the example below. Roles could be project manager, consultant, architect or others, depending on the project.
The finished matrix could look as follows.
RACI chart example
This the chart for the fictitious scenario from construction.